Gallery: Single stable neutron star
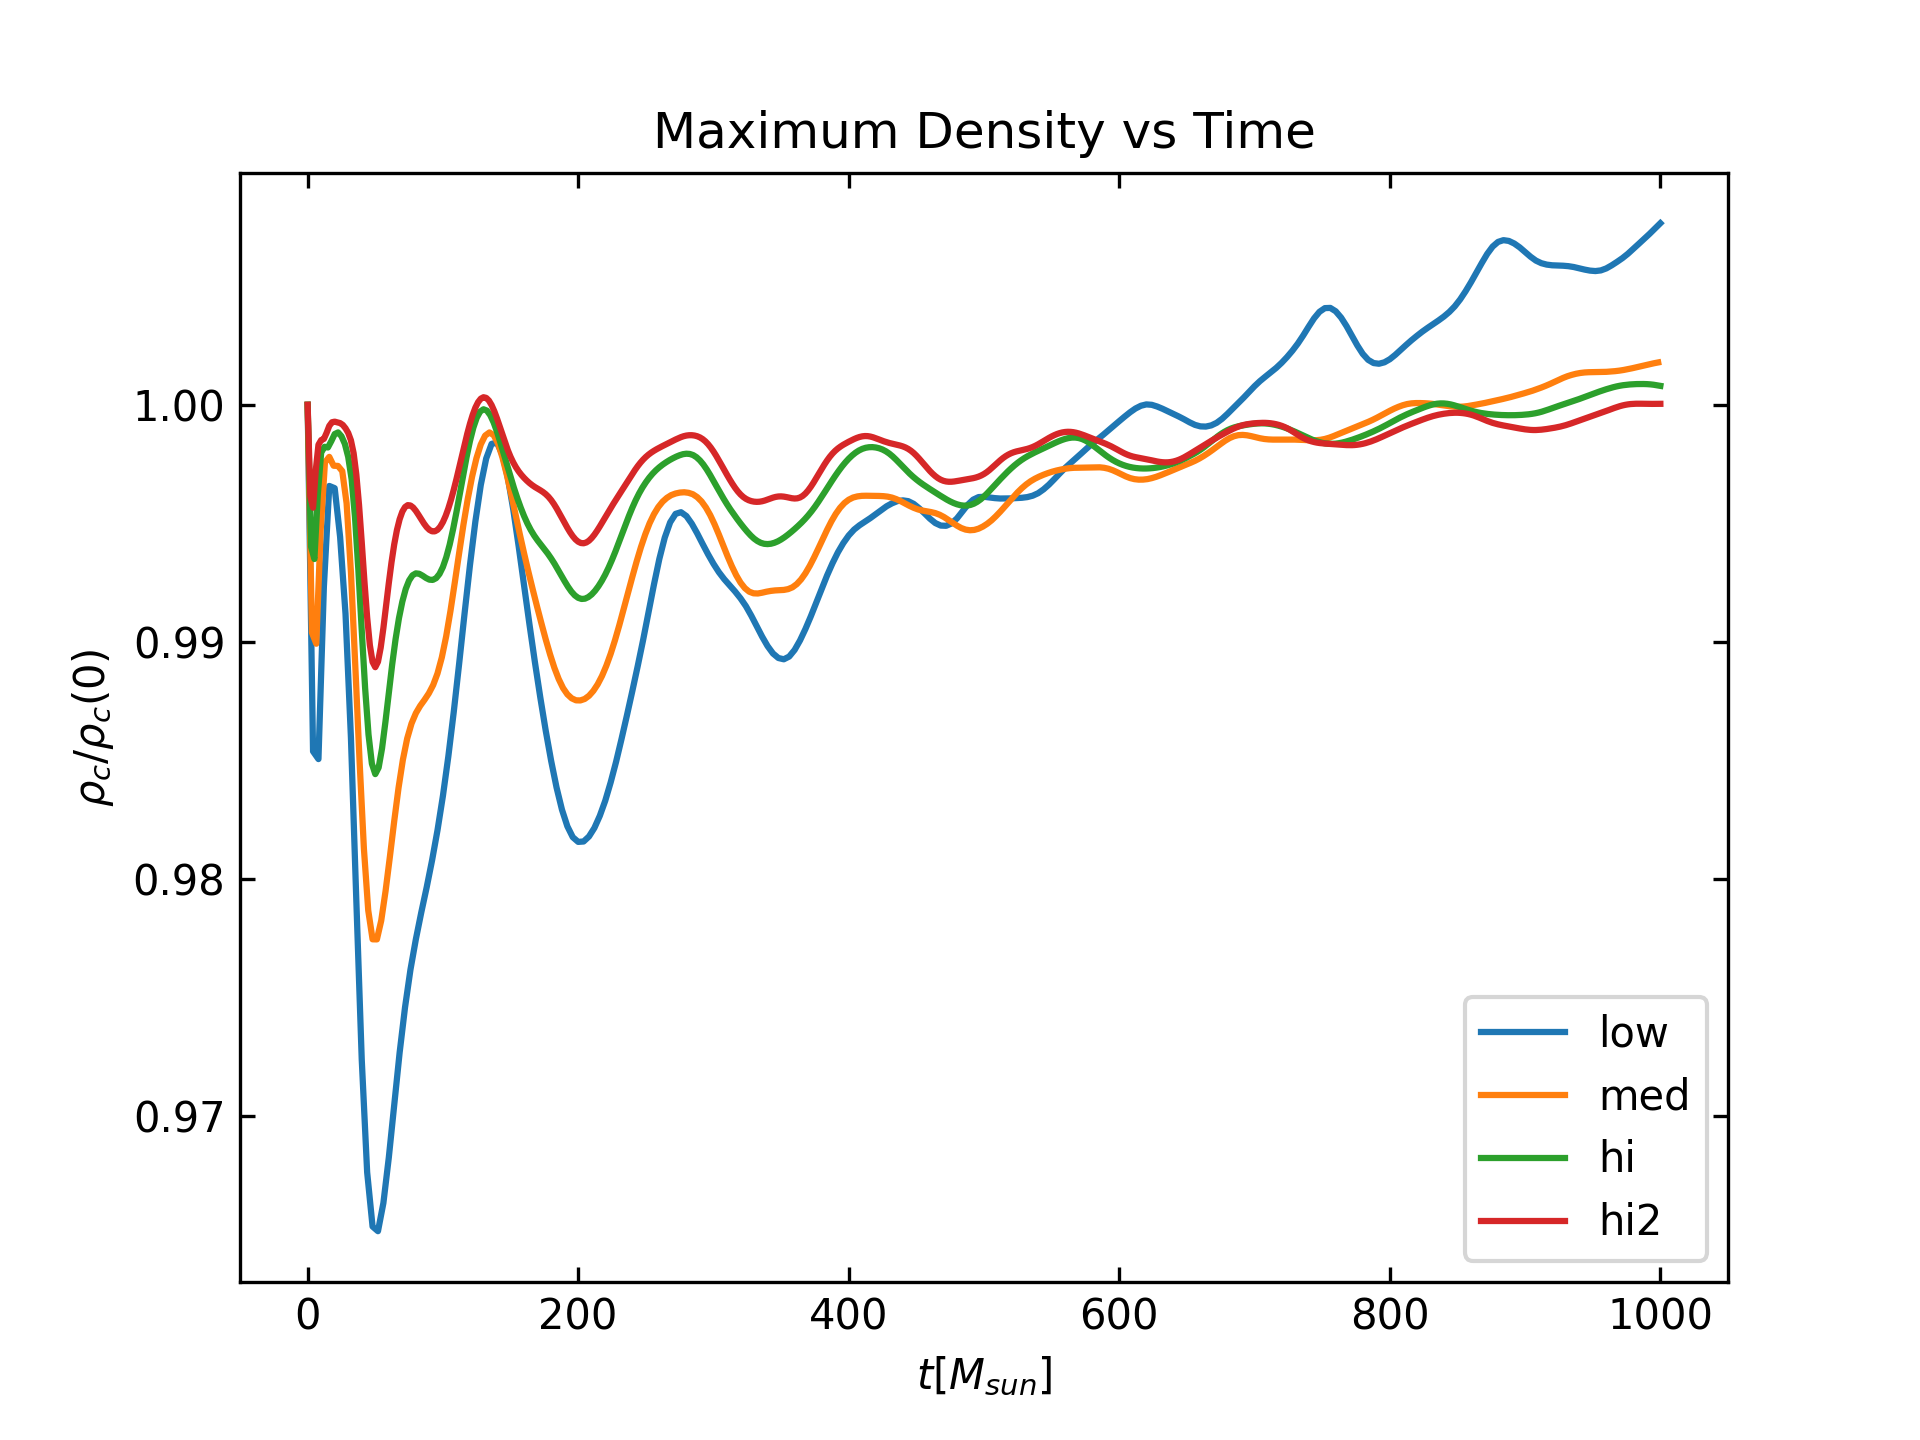
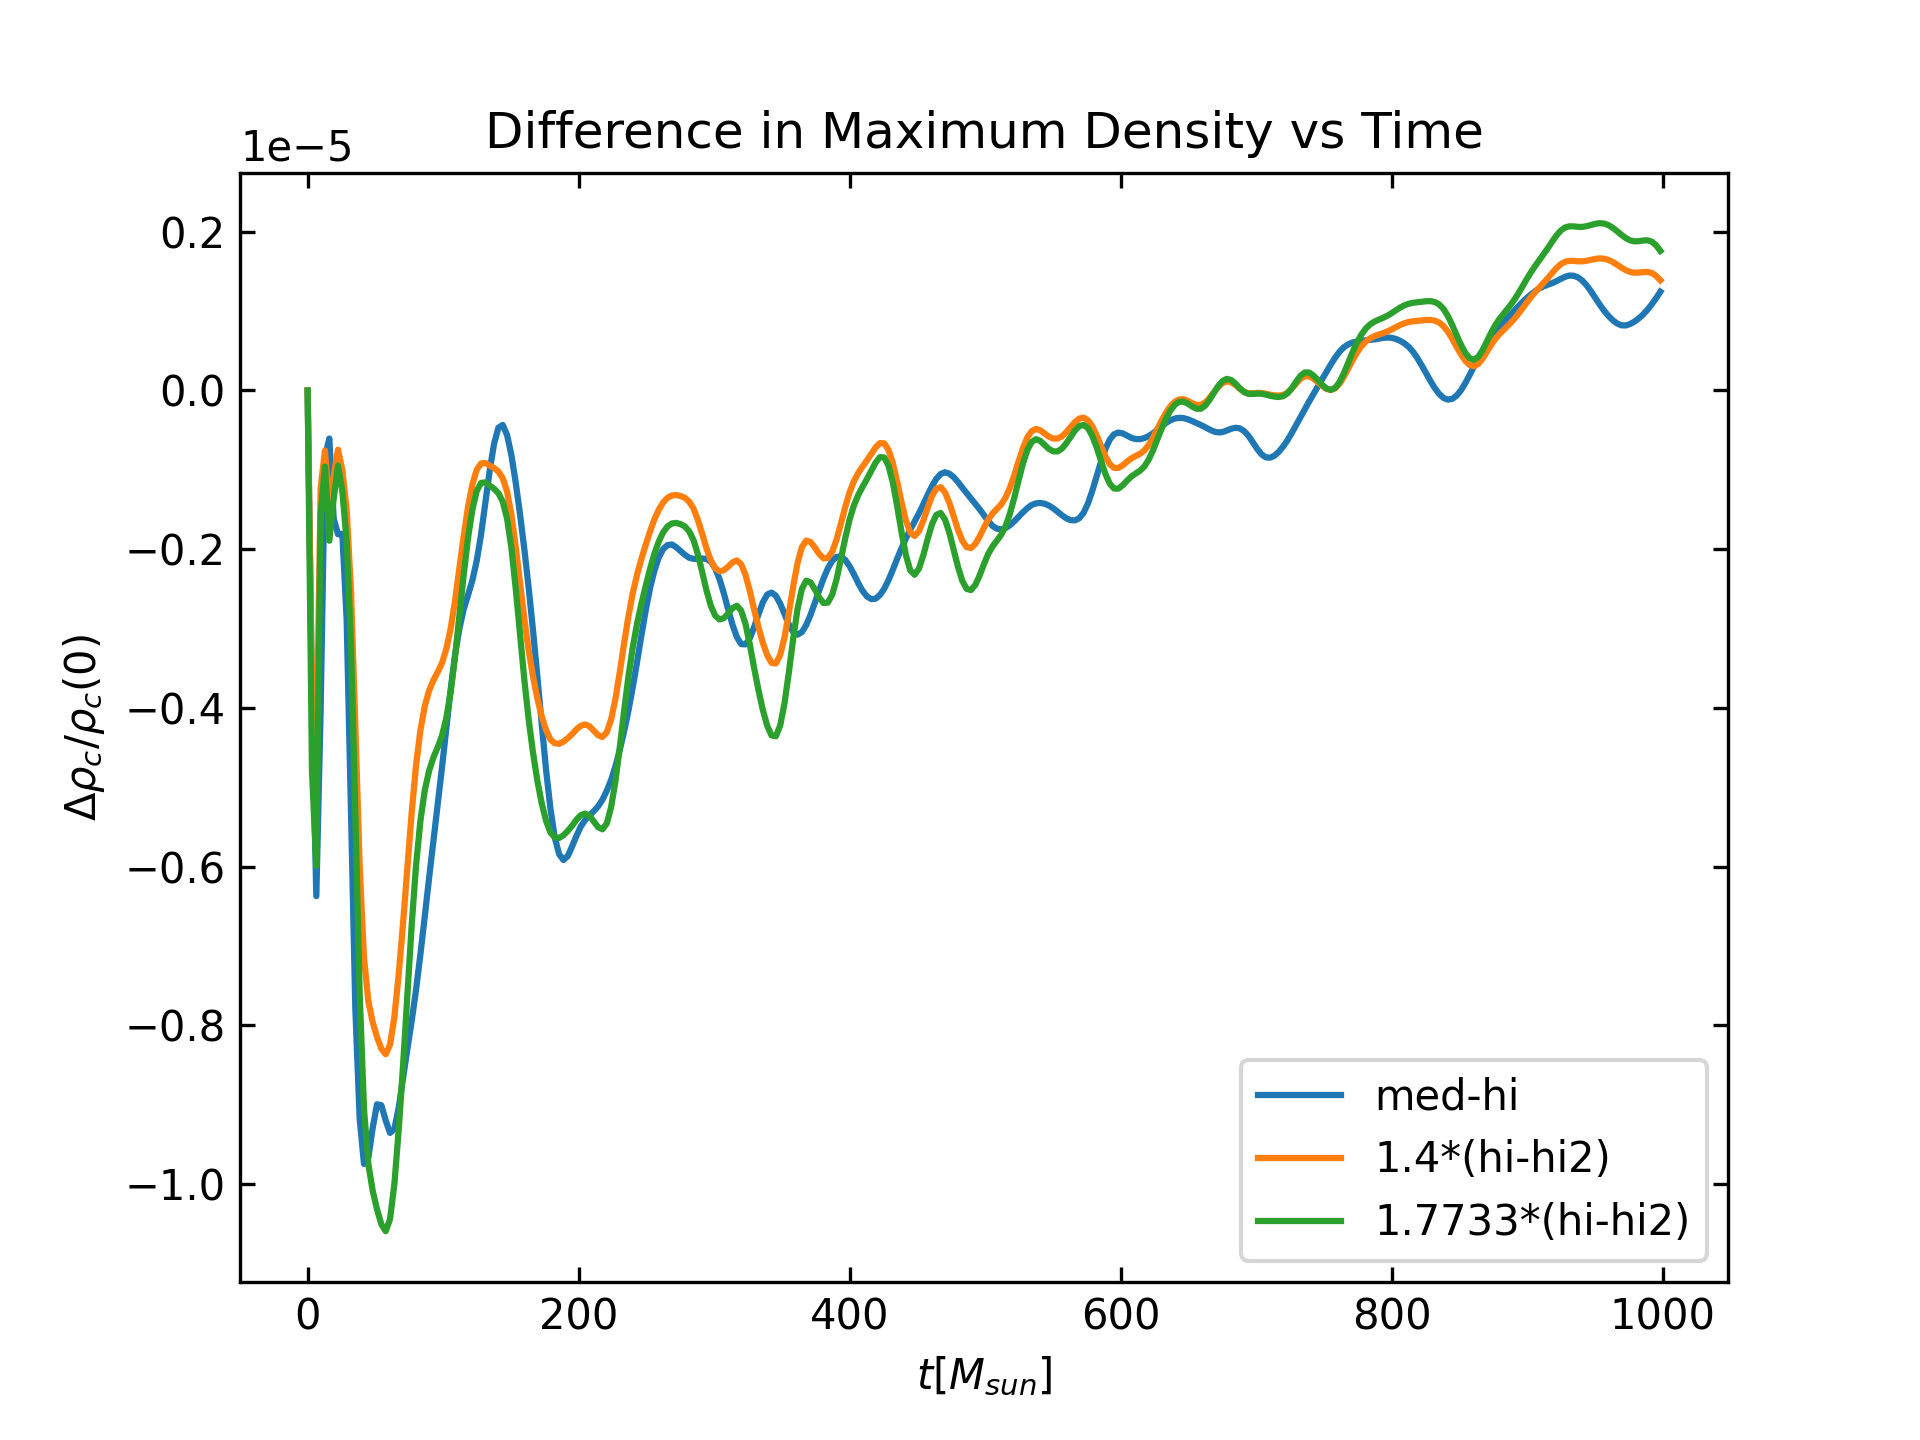
This simulation shows how to evolve a stable, single neutron star, and is a low resolution example of the case presented on our release paper; see Fig. 15 of https://arxiv.org/abs/1111.3344. It uses a TOV solution as initial data and follows the initial (numerical) perturbations, writing the maximum density to disk. For the test described here, we set up a self-gravitating fluid sphere described by a polytropic equation of state \(P = K \rho^\Gamma\) with K = 100 and \(\Gamma = 2\), and an initial central density of \(\rho = 1.28 \times 10^{-3}\). This model can be taken to represent a non-rotating NS with a mass of \(M = 1.4 M_\odot\). The evolution has been done with 4 different resolutions in order to show convergence. The first plot shows the maximal density as function of time for the 4 different resolutions: low (blue), medium (orange), high (green) and highest (red). The initial spike is due to the perturbation of the solution resulting from the interpolation onto the evolution grid. The remaining oscillations are mainly due to the interaction of the star and the artificial atmosphere and are present during the whole evolution. The second plot shows the convergence in maximal density for the three highest resolutiuons. The blue curve is the difference between the medium and high resolutions. The orange curves is the difference between the high and highest resolutions scaled for 1st order convergence. The green curve is the difference between the high and highest resolutions scaled for 2nd order convergence
| Parameter files | tov_gallery_polytrop.par, tov_gallery_polytrop_med.par, tov_gallery_polytrop_hi.par, tov_gallery_polytrop_hi2.par |
|---|---|
| Thornlist | ET Kruskal release (ET_2025_05) |
| Setup | 1 Core; 1 MPI Process with 1 Thread |
| approx. runtime (HH:MM:SS) | |
| Low res: | 01:11:00 |
| Medium res: | 05:49:00 |
| High res: | 08:39:00 |
| Highest res: | 11:38:00 |
| Results (0.43 Mb) | tov_20260325.tar.gz |
The plots of the maximum of the density and the convergence can be plotted using kuibit using this script.