Generate plots for the binary black hole GW150914 simulation
Using Mathematica
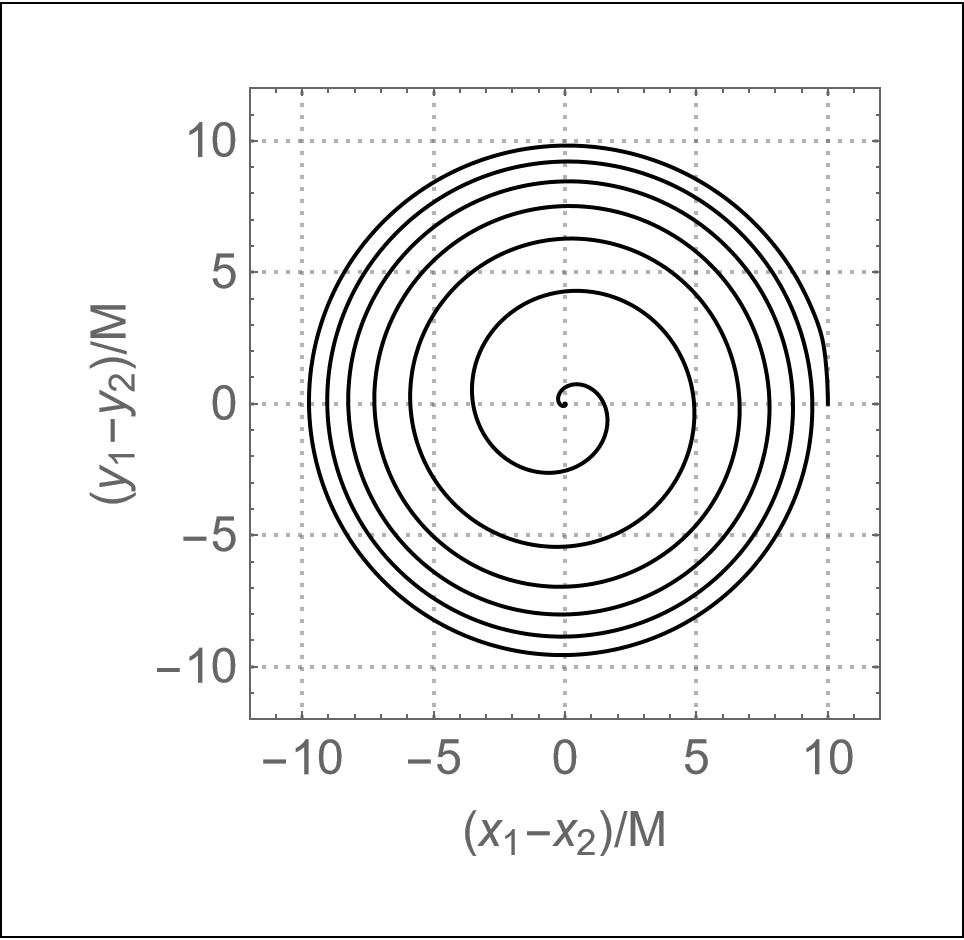
Horizon coordinate trajectories
To plot the trajectory using Mathematica, download the Trajectories code and simply run
wolframscript -script trajectories.m --simulations-directory ~/simulations
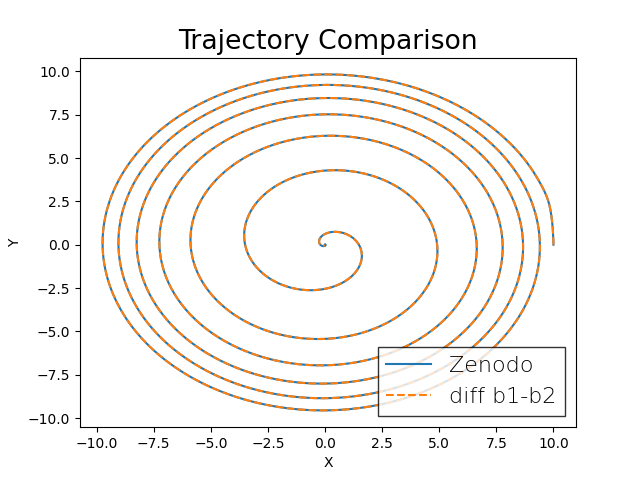
In addition, this code also outputs the trajectory data as a simple csv file. You can then compare the output from the simulation with the reference trajectory using this python script:

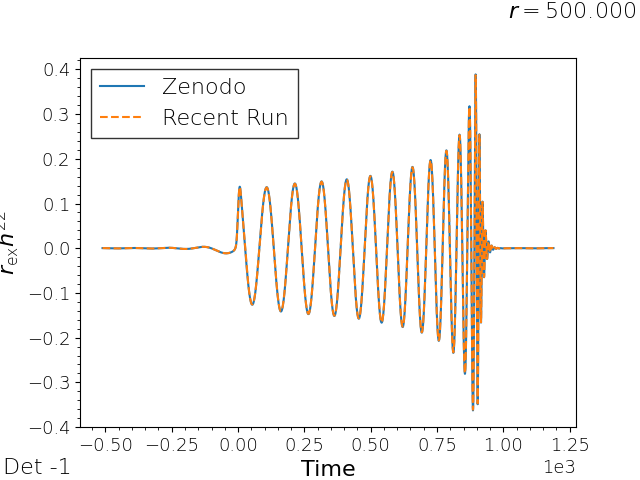
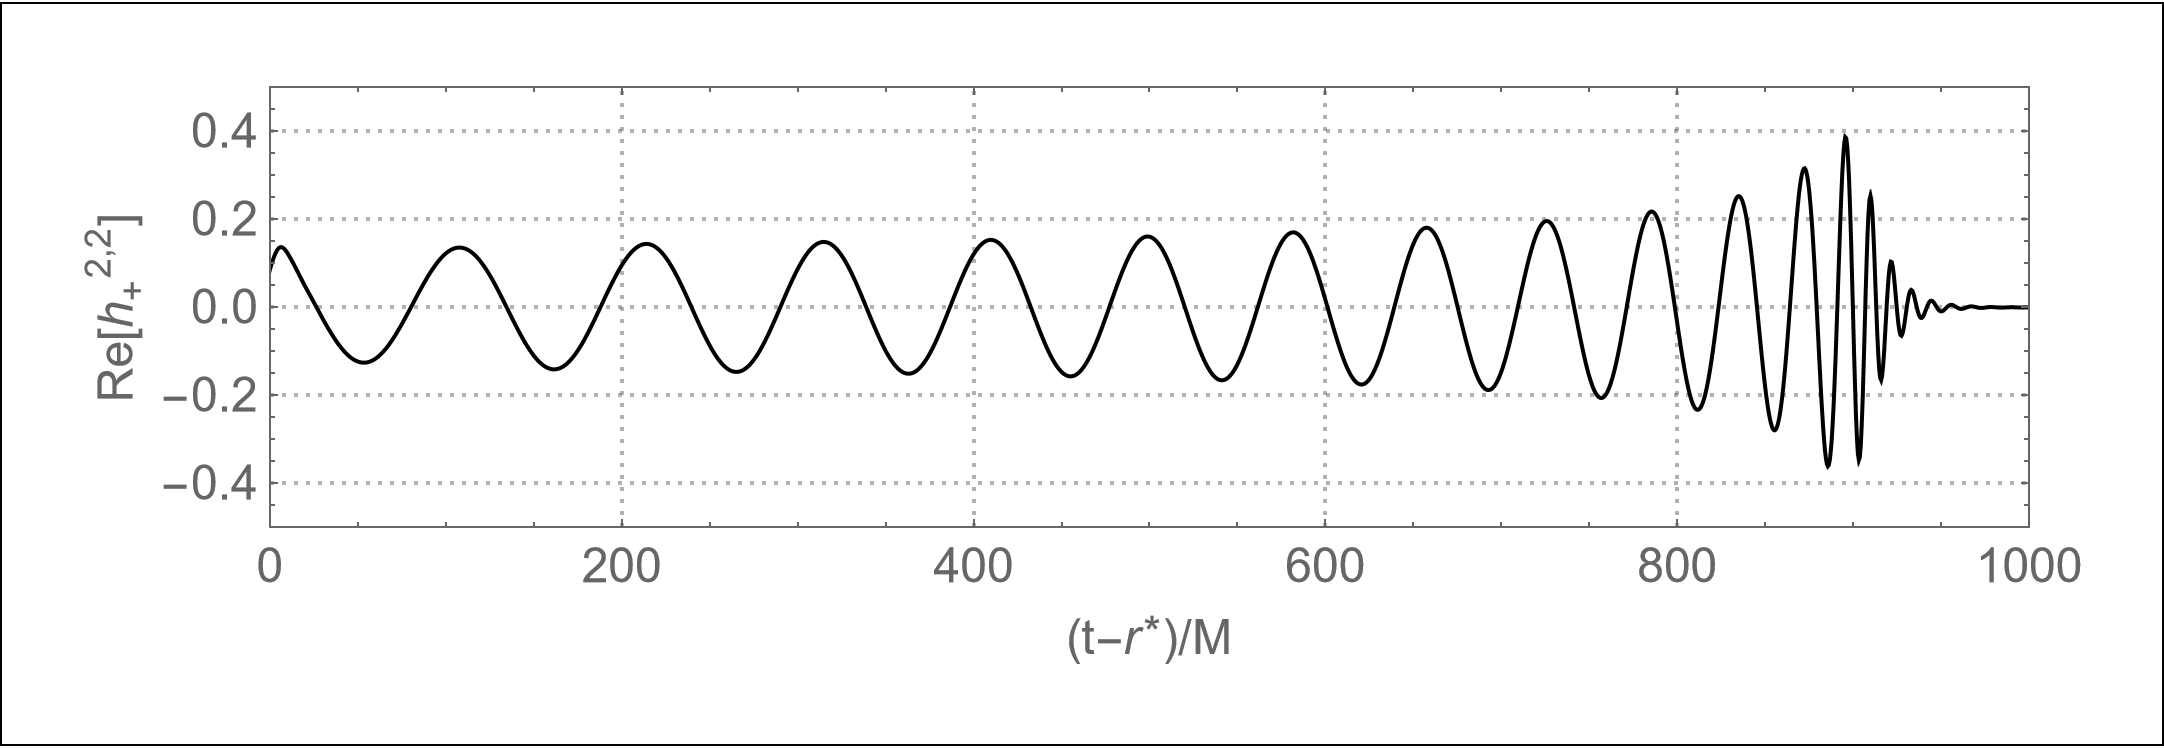
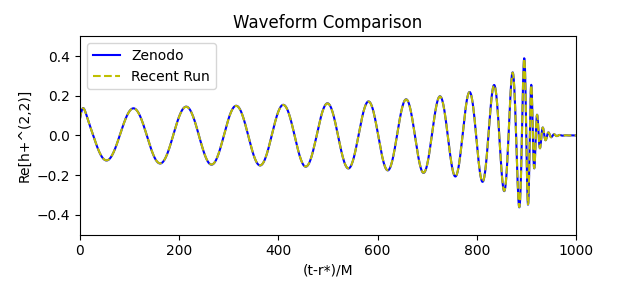
Gravitational waveform
The gravitational wave strain plot can be similarly produced using this Mathematica script:
wolframscript -script waveform.m --simulations-directory ~/simulations
To compare the output waveform data, use this python script and this csv file for the reference data.
Using Kuibit
Alternatively, the comparison plots can be created with Kuibit. Kuibit can be installed as follows:
        python3 -m pip install -U --user pip
        python3 -m pip install -U git+https://github.com/Sbozzolo/kuibit.git
        python3 -m pip install -U tikzplotlib
        python3 -m pip install -U requests
Once the above are installed, the trajectories.py and waveform.py scripts can be run as follows:
        python3 trajectories.py --datadir /work/USER/simulations/GW150914_28/
        python3 waveform.py --datadir /work/USER/simulations/GW150914_28/