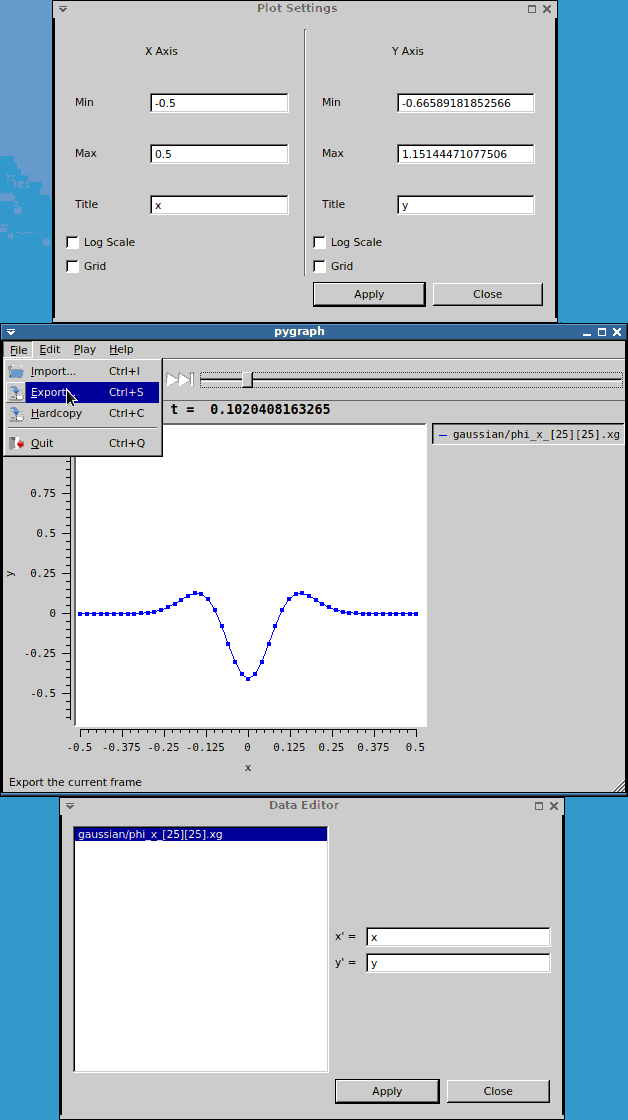
pyGraph: Animated, Easy Client for 1D Line Plots
Using pyGraphpyGraph can be used to view one or multiple 1D data files with the format "Time=0.0 0.0 0.0 0.2 0.04 0.4 0.16 0.6 0.36 0.8 0.64 1.0 1.0 "Time=1.0 0.0 0.0 0.2 -0.04 0.4 -0.16 0.6 -0.36 0.8 -0.64 1.0 -1.0 Such files can be created with the Cactus thorns CactusBase/IOASCII and CactusBase/IOBasic Viewing files is as easy as typing ygraph <data filename> <data filename> The are several options for customising aspects of and using ygraph, a manpage can be built from the source, or type pygraph --help for more information. If you are using thorn CactusConnect/HTTPD you can setup your browser to automatically view any advertised ygraph files. Instructions on how to do this are provided in the WebServer-HOWTO. Getting Hold of pyGraphBinaries and source code for ygraph are all available from the pyGraph mercurial repository. InstallationpyGraph requires the following packages to be available
        pip install --user hg+https://bitbucket.org/dradice/scidata
        pip install --user hg+https://bitbucket.org/dradice/pygraph
SupportPlease direct questions about pyGraph to its bitbucket ticket page https://bitbucket.org/dradice/pygraph/issues |