Analyzing and visualizing simulations
It is often necessary to analyze and visualize the output of a simulation to extract its scientific content. To this end, it is best to using libraries purposefully designed to work with the toolkit.
Kuibit
Kuibit is a Python library to analyze and visualize simulations officially included in the Einstein Toolkit. The package reads simulation data and offers high-level intuitive interfaces to manipulate it.
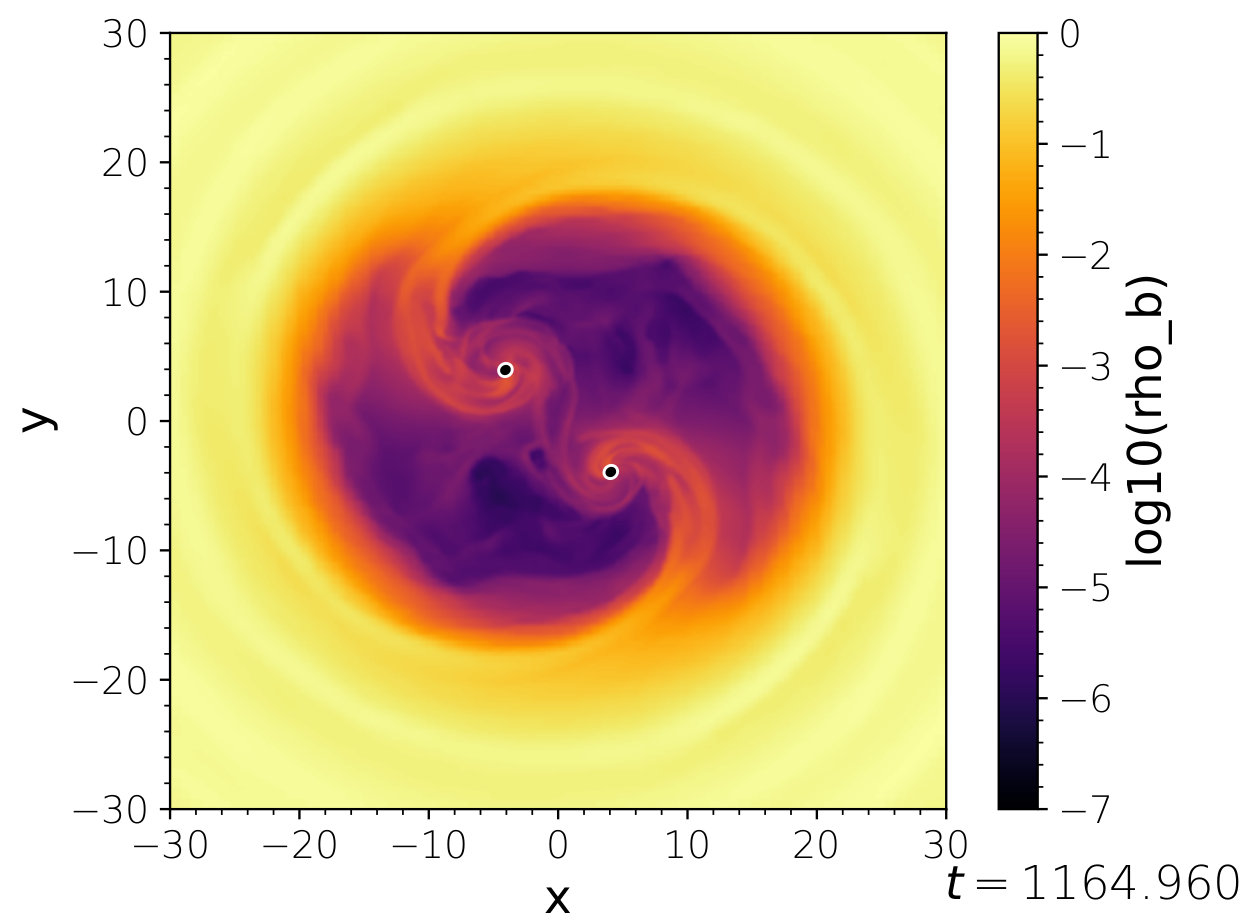
The Einstein Toolkit comes with several kuibit scripts in Cactus/utils/Analysis/kuibit/examples, but the package has to be installed separately with pip. The included scripts can be used to make plots of grid functions, timeseries, gravitational waves, and other quantities. On the right, we show an example of a plot generated by one of these scripts, plot_grid_var.py.
Kuibit has its own documentation (which includes tutorials on how to use the package) and bug tracker.
Visit
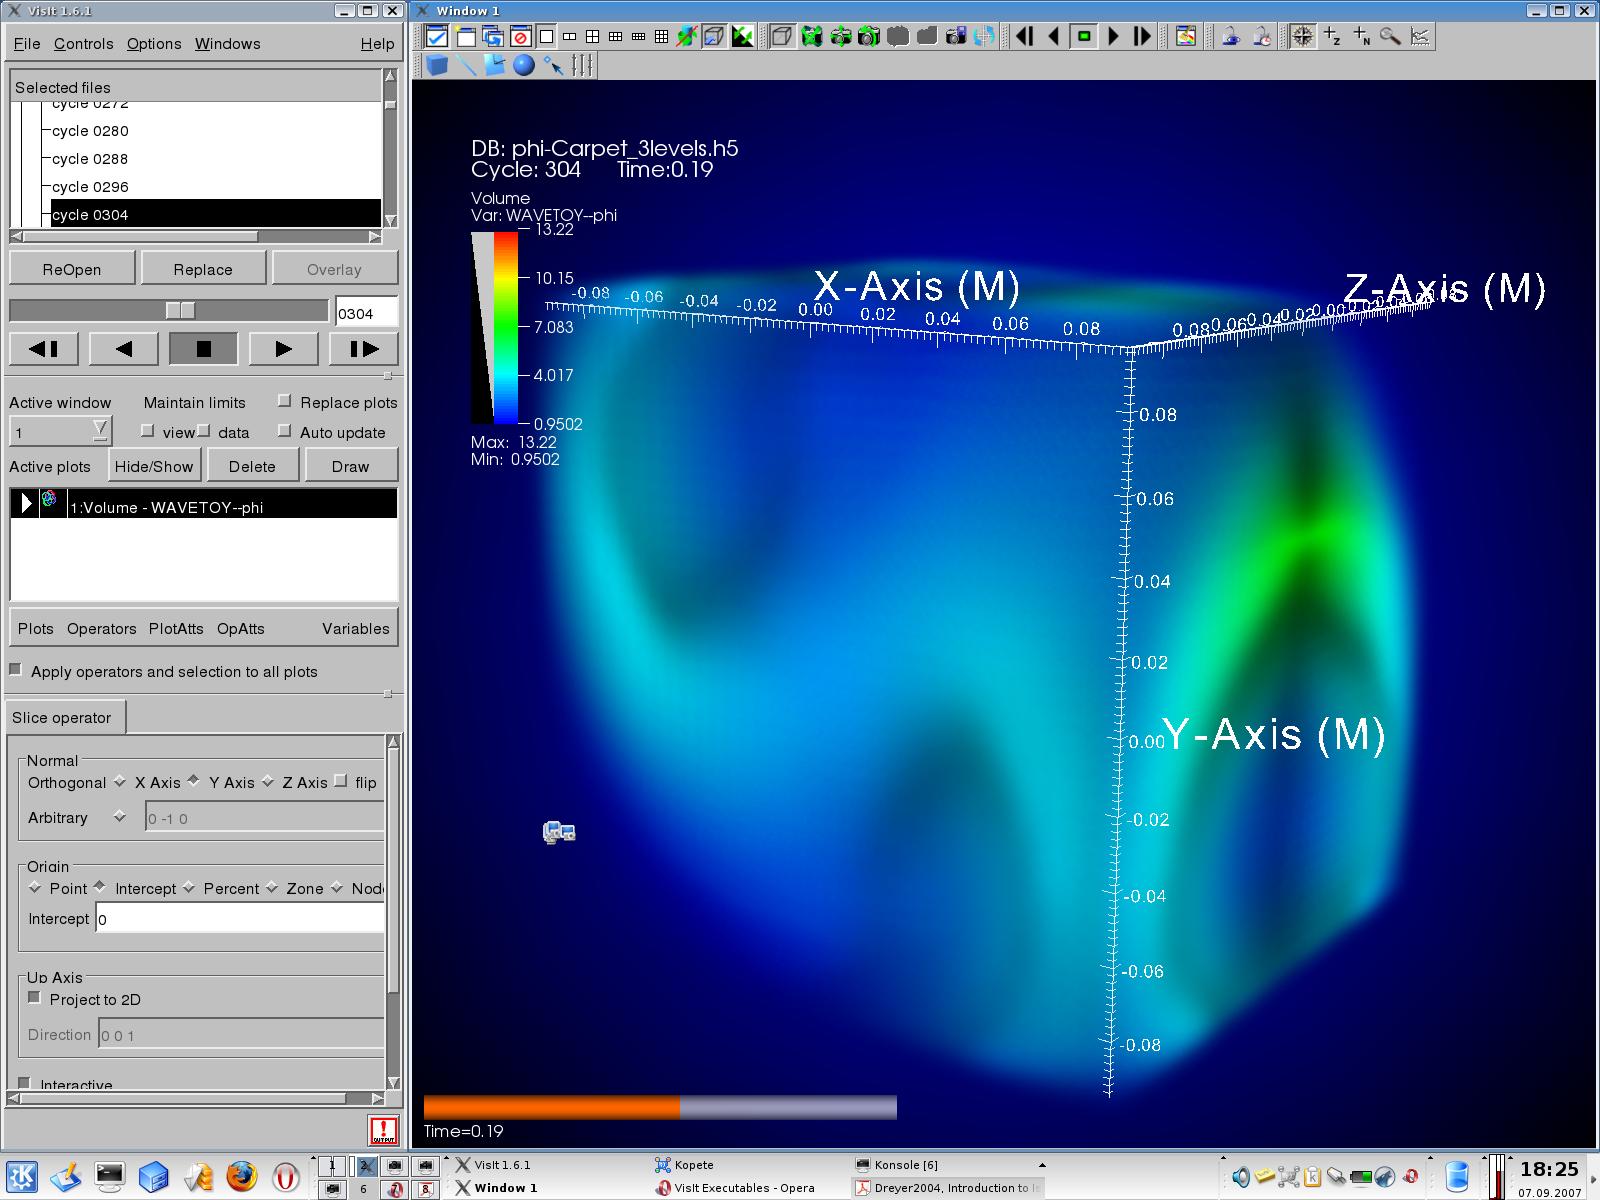 Visit is a powerful general-purpose visualization tool based on the
open source VTK library and is developed and maintained at the
Lawrence Livermore National Laboratory. Visit can read HDF5 grid
files output by the Einstein Toolkit and is especially suited for
complex 3D plots. Visit offers a graphical user interface and can be
scripted with Python.
Some of the gallery examples contain Visit scripts, for example,
GW150914.
Visit is a powerful general-purpose visualization tool based on the
open source VTK library and is developed and maintained at the
Lawrence Livermore National Laboratory. Visit can read HDF5 grid
files output by the Einstein Toolkit and is especially suited for
complex 3D plots. Visit offers a graphical user interface and can be
scripted with Python.
Some of the gallery examples contain Visit scripts, for example,
GW150914.