Compile and run binary black hole GW150914
Download
If you don't already have the Einstein Toolkit downloaded, you can download it as described here. You can use the current release version.
Download the parameter file:
cd Cactus
curl -Lf https://bitbucket.org/einsteintoolkit/einsteinexamples/raw/master/par/GW150914/GW150914.rpar -o par/GW150914.rpar
If you already have the Einstein Toolkit downloaded, configured and built, you can skip to Run.
Compile
Configure SimFactory for your machine:
- If you are on a cluster that SimFactory supports, run
simfactory/bin/sim setup
Hit enter for each question if the default is OK. If you intend to run on a cluster that requires an allocation, make sure to configure this during setup. - If you are not using a cluster supported by SimFactory, see Compiling the Einstein Toolkit for instructions.
Compile Cactus (on 4 processes concurrently; you are encouraged to increase this value if you have more cores available and are impatient):
simfactory/bin/sim build -j 4 --thornlist manifest/einsteintoolkit.th
Run
Note that the simulation requires about 82 GB of RAM, so most likely you will need to use a cluster. Submit the simulation:
simfactory/bin/sim create-submit GW150914_28 --define N 28 --parfile par/GW150914/GW150914.rpar --procs 128 --walltime 24:00:00
You can choose a different number of cores than 128; if it is too small, the simulation will run out of memory.
When the simulation starts running, it will write its output data into GW150914_28 in your simulations directory. You can find the directory containing the output with:
simfactory/bin/sim get-output-dir GW150914_28
You can see the status of the simulation with
simfactory/bin/sim list-simulations GW150914_28
for example
GW150914_28 [ACTIVE (RUNNING), restart 0000, job id 363502]
It will say FINISHED when the simulation has finished. You can check the output while it is still running.
Output
You can see the console output of the simulation in
/path/to/GW150914_28/output-0000/GW150914_28.out
for example:
Simulation name: GW150914_28
Running simulation GW150914_28

       10
  1   0101       ************************
  01  1010 10      The Cactus Code V4.3.0
 1010 1101 011      www.cactuscode.org
  1001 100101    ************************
    00010101
     100011     (c) Copyright The Authors
      0100      GNU Licensed. No Warranty
      0101
--------------------------------------------------------------------------------

Cactus version:    4.3.0
...
----------------------------------------------------------------------------------------------------------
Iteration      Time | *me_per_hour |              ML_BSSN::phi | *TISTICS::maxrss_mb | *TICS::swap_used_mb
                    |              |      minimum      maximum |   minimum   maximum |   minimum   maximum
----------------------------------------------------------------------------------------------------------
        0     0.000 |    0.0000000 |    0.0005741    0.9995490 |      2580      3510 |         0         0
        4     0.009 |    3.0212222 |    0.0005853    0.9995490 |      2781      3811 |         0         0
        8     0.017 |    5.5436288 |    0.0005960    0.9995490 |      2781      3811 |         0         0
       12     0.026 |    7.4708510 |    0.0006063    0.9995490 |      2781      3811 |         0         0
       16     0.034 |    9.2093008 |    0.0006161    0.9995490 |      2781      3811 |         0         0
...
Visualise
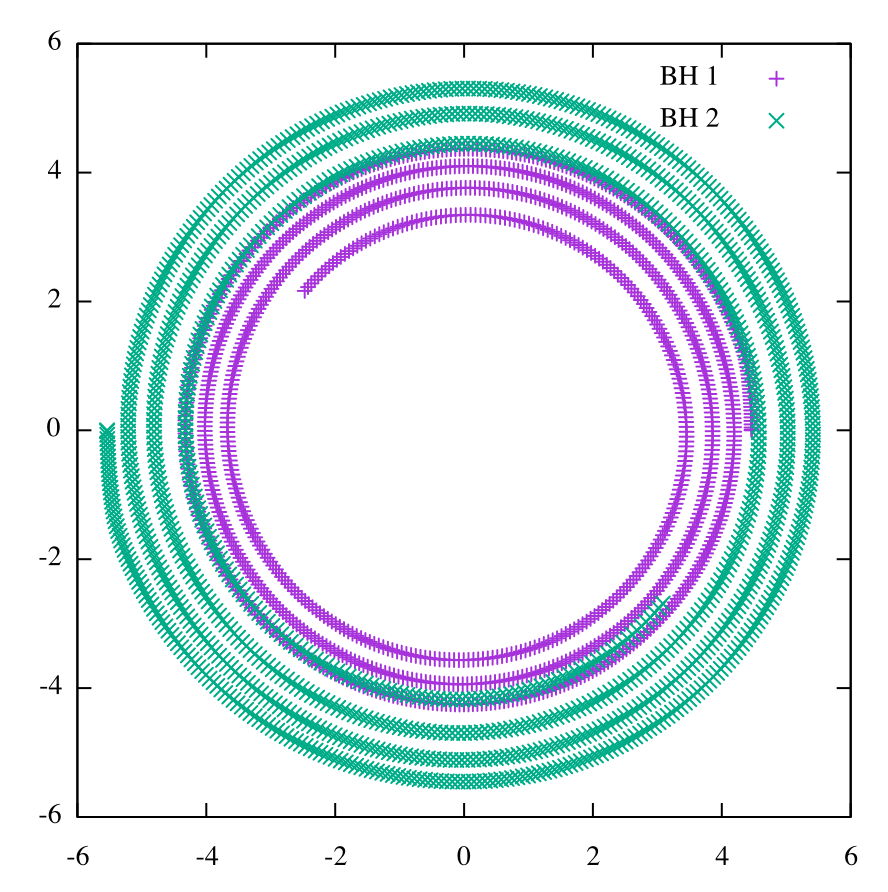
You can do a quick-and-dirty visualisation of the coordinate tracks of the black holes with gnuplot:
cd /path/to/GW150914_28/output-0000/GW150914_28
gnuplot

set size square 0.75,0.75
set key
plot 'puncturetracker-pt_loc..asc' u 23:33 title "BH 1", 'puncturetracker-pt_loc..asc' u 24:34 title "BH 2"
